Key points
- In three large studies, only 8% to 23% of components showed age-related failure. Replacing parts on a fixed schedule helps only that minority.
- Maintenance itself causes failures. NASA's guide warns that scheduled overhaul can raise the failure rate by resetting parts to infant mortality.
- Set inspection intervals from the P-F interval, the warning time a failure gives, not from how often it fails. A common rule is half the P-F interval.
- The money is real: NIST found the most reactive manufacturers had 3.3 times the downtime and 16 times the defects of the least reactive.
Preventive maintenance, and the four ways to trigger it
Every maintenance strategy answers one question: when do we touch this asset? Reactive maintenance answers "when it breaks". Preventive maintenance answers "before it breaks", and the interesting part is how you decide what "before" means. There are four triggers, and a mature programme uses all of them.
| Trigger | Work is due when | Best for | Watch out for |
|---|---|---|---|
| Calendar | A date arrives: every week, quarter, year | Things that age whether they run or not, and anything regulated: fire systems, lifts, pressure vessels | Over-servicing idle assets and under-servicing busy ones |
| Usage | A meter reaches a point: 250 h, 10,000 km, 50,000 cycles | Engines, compressors, gearboxes, vehicles, presses | Only as good as the meter readings behind it |
| Condition | A measurement crosses a limit: vibration, temperature, oil debris, wear | Parts that fail at random ages but give warning first | An inspection interval longer than the warning time |
| Predictive | A trend in continuous data forecasts a failure | Critical, expensive assets with sensors fitted | Cost of sensors and someone to read the data |
Strictly, condition-based and predictive maintenance are their own strategies, and some textbooks keep them apart from preventive maintenance. In practice every maintenance team plans all four from the same schedule, so this guide treats them as one family. One more option belongs on the list: run to failure, chosen on purpose, for assets whose failure is cheap, safe and quick to fix. A light bulb in a corridor does not need a PM. Deciding that in writing is part of a good programme, not a gap in it.

The study most PM programmes have never heard of
In the 1960s and 70s, United Airlines analysed failure data from its aircraft components to find out whether overhauling parts at fixed ages actually made them more reliable. The work, published by Stanley Nowlan and Howard Heap in 1978 as Reliability-Centered Maintenance, sorted components into six patterns according to how their risk of failure changes with age. Two later studies, in Sweden in 1973 and for the US Navy in 1982, repeated the exercise. NASA's own maintenance guide reproduces all three side by side:
Read the bottom two lines. Only 11% of the airline's components, 8% of the Swedish sample and 23% of the Navy's showed failures that become more likely with age. In NASA's words: "In these three studies, random failures are between 77 and 92 percent of the total failures and age-related failure characteristics for the remaining 8 to 23 percent."
This is the most misunderstood fact in maintenance, so be careful with what it does and does not say. It does not say preventive maintenance is useless. It says the type of task matters. A "replace every 2,000 hours" task belongs on parts with a genuine wear-out age: tyres, brake linings, belts, filters, cutting edges, impellers in abrasive service. For a part that fails at random, replacing it on a date resets nothing, because a new part is as likely to fail tomorrow as the old one. What does work for random failures is an inspection that looks for the warning signs, which is the subject of the P-F interval section below.
Two honest caveats. First, aircraft components are designed with redundancy and replaced often, which pushes the numbers towards random failure; the Navy data, closer to heavy mechanical plant, found 17% with a clear wear-out age. Second, the Navy's later analysis of submarine maintenance data, summarised by its submarine maintenance engineering office, reached a blunter conclusion: "In the majority of cases there is no relationship between overhaul time and reliability" (Reliabilityweb). Your own assets will sit somewhere in that range, and your own failure history is the only way to know where.
Maintenance that causes the failure it was meant to prevent
Look again at the largest bar in the chart: infant mortality, 68% of the airline's components. A part following that pattern is most likely to fail just after it is new, which includes just after it has been removed, refitted or overhauled. NASA's guide puts it plainly: "In many cases scheduled overhaul increases the overall failure rate by introducing a high infant mortality rate into an otherwise stable system." And: "Imposing an arbitrary preventive task often increases the average failure rate through the resetting of 'infant mortality.'"
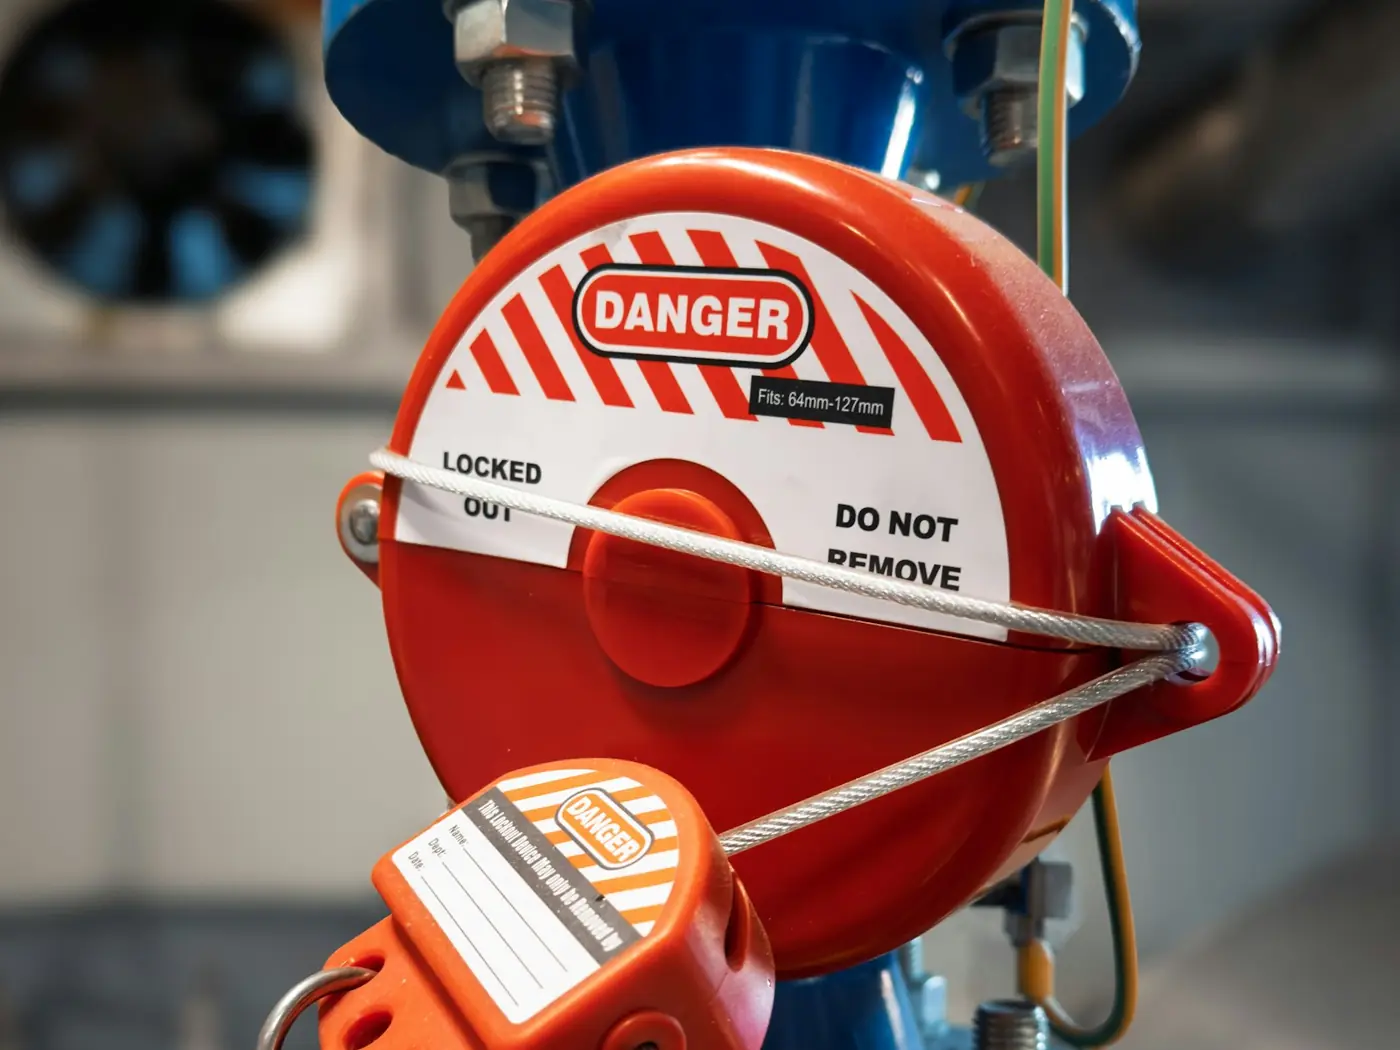
Aviation, which counts these things carefully, shows the human side of it. An FAA review of ten years of US general aviation accident reports found installation errors to be the leading maintenance-related cause (FAA, DOT/FAA/AM-02/23, 2002). Summarising that review, AOPA reports that 1,474 of 20,884 accidents, 7.1%, listed a maintenance error as a primary cause or factor (AOPA, 2021). The US Department of Energy's maintenance guide lists the same risk among the disadvantages of preventive maintenance: "Potential for incidental damage to components in conducting unneeded maintenance" (DOE FEMP, 2010).
How to keep the benefit and cut the risk:
- Prefer non-intrusive tasks. Look, listen, feel, measure, sample the oil. Open the machine only when a measurement or the manufacturer gives a reason.
- When you must open it, write the reassembly down. Torque values, new seals and gaskets, the order of steps. A checklist on the PM is cheaper than a second breakdown.
- Test before you hand it back. Run the machine and check for leaks, noise and temperature before it returns to production, not after.
- Record what you found, not just what you did. "Bearing replaced" tells you nothing next year. "Bearing replaced, found pitted and running hot" tells you the interval was right.
- Count the failures that follow a PM. Track breakdowns on the same machine within, say, a week or 50 hours of a service. A machine that keeps failing just after its PM is telling you something about the PM.
The P-F interval: what should set your inspection frequency
If most failures are not age related, what stops them? Warning. Most failures do not arrive out of nowhere: a bearing gets noisy and warm before it seizes, a belt cracks before it snaps, a contact runs hot before it burns. The P-F curve describes this. P is the point where a developing failure can first be detected; F is the point where the asset actually fails. The time between them is the P-F interval, and it is the window in which an inspection can catch the problem and turn a breakdown into a planned repair.
The rule that follows is simple and often broken: inspect more often than the P-F interval, or the failure can develop and complete between two visits. In practice, "inspection intervals that are equal to half of the P-F interval are considered to be adequate" (ReliaSoft, citing Moubray's RCM). NASA's guide is more cautious: "At least three maintenance tasks should be performed between the point of initial degradation and point of initial detection", and once a problem is found, "the monitoring interval should be reduced to between one-third and one-quarter of the prior interval" (NASA, 2008).
| Warning sign | What it often reveals | How it is checked |
|---|---|---|
| Vibration | Bearing wear, imbalance, misalignment, looseness | Hand-held vibration meter, fitted sensors, a trained ear |
| Heat | Loose electrical connections, overloaded motors, failing bearings, blocked coolers | Thermal camera, contact thermometer |
| Oil condition | Internal wear (metal particles), contamination, coolant leaks, degraded oil | Oil sample sent to a lab, magnetic plugs, filter inspection |
| Sound | Compressed air and steam leaks, early bearing faults, electrical discharge | Ultrasound detector |
| What you can see | Leaks, cracks, corrosion, worn belts and hoses, missing guards | A walk-round with a checklist and a torch |
| Electrical readings | Insulation breakdown, unbalanced phases, failing contactors | Insulation tester, clamp meter, multimeter |

When replacing on a schedule does work: the Weibull test
Reliability engineers have a tidy way to tell the patterns apart. Fit the ages at which a part has failed to a Weibull distribution and look at one number, its shape parameter, written β (beta). NASA's guide: "For beta <1 the hazard rate decreases. For beta >1 the hazard rate increases. For beta =1 the hazard rate is constant."
| Shape (β) | What it means | What to do |
|---|---|---|
| Below 1 | Infant mortality: risk falls with age | Do not replace on a schedule. Fix installation quality, burn-in, and spares quality |
| Around 1 | Random: risk is the same at every age | Inspect for warning signs on the P-F interval, or run to failure if that is cheap and safe |
| Above 1 | Wear-out: risk rises with age | Scheduled replacement can pay, if a planned replacement costs less than a failure |
ReliaSoft's reliability software states the same condition before it will even calculate an optimum replacement time: "The failure rate of the component in question increases with time, implying wearout", so "Weibull distributions must have beta > 1" (ReliaSoft BlockSim). The second condition is economic: the planned replacement must cost less than the failure it prevents, including the downtime.
You do not need statistics software to use the idea. Pull the failure history for one part across all your similar machines and look at the ages at which it failed. If the failures bunch together (most between 3,000 and 4,000 hours, say), you have wear-out and a replacement interval just before the bunch is sensible. If they are spread from week one to year five, a replacement interval will not help, and an inspection will.
This is also why the failure history matters more than any software feature: without dated failures recorded against the right machine and the right part, none of this analysis is possible, and every interval stays a guess copied from a manual.
Meters and milestones: getting the schedule itself right
Once you know which tasks belong on a schedule, the schedule has to count in the unit the part wears in: run hours for engines and compressors, kilometres for vehicles, cycles for presses and doors, the calendar for anything that ages while idle. Many assets need two triggers at once, judged separately, with whichever comes first being the one that is due.
The subtle part is how the next due point is calculated. If it is "last service + interval", a 250-hour service done late at 285 hours pushes every later service 35 hours off the manufacturer's grid, and the big 1,000-hour service stops lining up with the small ones. Scheduling against fixed milestones (250, 500, 750, 1,000 hours) avoids that drift. Our guide to preventive maintenance intervals works through it with examples.
One practical warning: a usage-based schedule is only as current as the last meter reading. A machine whose hour meter has not been read for two weeks is not "on schedule"; its status is unknown. Treat stale meters as a problem in their own right.
PM compliance: the number most teams measure wrong
PM compliance asks: of the preventive work that fell due, how much was done on time? It sounds simple and is easy to flatter. The most common distortion is the grace period: "due on the 1st, but anything this month counts". Every grace period quietly lengthens the real interval, and on a part with a short P-F interval that is exactly the margin you needed.
A widely used answer is the 10% rule: a PM counts as on time when it is done within 10% of its interval of the due point. "Applying the 10% rule, if the PM is triggered every 30 days, then the PM should be completed +/- 3 days of when it was due. The goal of the 10% rule is to keep our PM intervals consistent" (Jeff Shiver, Plant Services). The same logic works for meters: a 250-hour service is on time within 25 hours.
- Measure per service that fell due, not per work order closed. A team can close 100% of the work orders it chose to raise and still miss half the services that were due.
- Keep "never serviced" apart from "overdue". A machine with no service on record is a gap in the records. Mixing it with genuinely overdue work hides both problems.
- Never close a meter-based PM without the meter reading. Without it you cannot tell whether it was on time, and the next due point is a guess.
- Look at the tasks that never find anything. A task that has found nothing in two years is either working perfectly or checking the wrong thing. Ask which failure mode it is there to catch.
That last point is where many programmes find their quickest saving. PM task lists grow for years and are rarely pruned. In one PM optimisation case study, a consultancy reviewing an adhesive tape manufacturer judged "54% of the existing PM tasks" to be non-value-added and deleted 50 of 111 (Marshall Institute). It is one case, not a benchmark, but the exercise of asking "which failure does this task prevent?" of every line is worth doing on any programme older than a few years.
What preventive maintenance is worth: numbers that hold up
The most rigorous recent source is the US National Institute of Standards and Technology. Its 2020 study of US discrete manufacturers estimated maintenance spending at $57.3 billion for 2016, with losses of $119.1 billion on top: "$18.1 billion due to downtime, $0.8 billion due to defects, and $100.2 billion due to lost sales from delays and defects." It then compared plants by how much of their maintenance was reactive:
Put the other way round, establishments that "invested more heavily into preventive or predictive maintenance, on average" had "44 % less downtime, 54 % lower defect rate, 35 % fewer lost sales due to defects from maintenance, and 29 % less lost sales due to delays from maintenance issues." These are associations across many plants, not a controlled experiment; well-run plants tend to do many things well. But the direction is consistent, and the size of the gap is hard to explain away.
The US Department of Energy's operations and maintenance guide puts the saving of a preventive programme over a reactive one at "12% to 18%" on average, adds that "many facilities purely reliant on reactive maintenance could save much more than 18%", and estimates a further "8% to 12%" for a well-run predictive programme over preventive alone. To its credit, the same guide lists the disadvantages too: preventive maintenance "includes performance of unneeded maintenance". Both halves of that sentence are the point of this article.
Downtime is where the money really sits. Siemens' 2024 survey of large manufacturers puts an hour of downtime in a large automotive plant at "$2.3 million an hour" and, at the low end, "$36,000 in Fast Moving Consumer Goods", with an average large plant still losing "27 hours a month to unplanned downtime" (Siemens, The True Cost of Downtime 2024). Your figures will be smaller and just as real: the lost output, the overtime, the hire machine, the late penalty, the rush freight on a part.
Building a PM programme in 2026, step by step
- Register every asset once. One record per machine, with its make, model, meters and location. Everything else hangs off it.
- Rank by criticality. What happens if it fails: safety, production stopped, cost, how long to fix. Spend your effort on the top of the list.
- List how the critical assets actually fail. Use the manual, your breakdown history and the people who repair them. Name the failure modes, not just the components.
- Choose a task type per failure mode using the table below. This is the step most programmes skip.
- Set intervals. Start from the manufacturer for wear-out tasks; use the P-F interval for inspections; pick the meter that matches the wear.
- Kit the parts and fluids each service consumes, so the stores can prepare and the job is not stopped halfway.
- Set a meter-reading routine and keep it: daily for plant in heavy use, weekly for vehicles.
- Record what was found, the meter, and the parts used on every completed PM.
- Review monthly: compliance within the 10% window, failures within days of a PM, tasks that never find anything, and machines that fail despite a perfect PM record.
| If the failure mode… | Then the task is |
|---|---|
| wears out at a fairly predictable age | Scheduled replacement or restoration, on the meter that drives the wear |
| gives warning before it fails | Condition inspection, more often than the P-F interval |
| is hidden until the moment it is needed (a standby pump, a relief valve, a fire alarm) | A functional test on a schedule: start it, trip it, prove it works |
| is random, gives no warning, and is cheap and safe | Run to failure, decided in writing, with the spare on the shelf |
| is random, gives no warning, and is dangerous or very costly | Redesign: a different part, a guard, redundancy |
Mistakes that quietly break PM programmes
- Putting every asset on PM. The effort is spread so thin that the critical machines get the same attention as the coffee machine.
- Copying the manual and never revisiting it. The manufacturer writes for an average duty in an average climate, and for warranty. Your duty and your failure history should adjust it, in both directions.
- Calendar schedules on usage-driven assets. A generator that ran 600 hours this month and one that ran 6 get the same service.
- Stale meters. Usage schedules silently stop working when nobody reads the meters.
- Ticking the checklist without recording the readings. "OK" in every box tells you nothing about the trend that would have warned you.
- Parts not ready. A PM that waits for a filter becomes a PM that is skipped.
- Letting a late PM re-phase the schedule. Covered above: schedule on fixed milestones.
- Measuring activity instead of outcome. Work orders closed is activity. Breakdowns, downtime and failures after PM are outcomes.
How much could proper PM save you, and how Solmex helps
We will not quote you a customer saving we cannot show you. What we can do is put the published figures above against your own numbers. Change the four inputs to match your site:
Estimate it on your own numbers
Any currency. Nothing you type leaves this page.
First figure: the reactive share of your spend × the 12% to 18% saving the US Department of Energy gives for preventive over reactive work. Second: your yearly downtime cost × 44%, the average downtime gap NIST measured between manufacturers that invested more in preventive or predictive maintenance and those that did not. That gap is an association across many plants, not a promise for yours; treat the second figure as a ceiling.
Solmex is maintenance software built so that the practices in this guide are the default rather than extra work:
- Hours, kilometres and the calendar, judged separately on the same machine, each with its own due-soon window, so a truck can be fine on hours and overdue on kilometres and you see both.
- Fixed manufacturer milestones. A late service never shifts the rest of the programme, and at 1,000 hours it is the 1,000-hour service that comes due.
- Never serviced is not overdue, and a meter unread for 14 days is flagged, so the gaps in your records are named instead of hidden.
- A projected due date from each machine's own meter readings, so the next eight weeks of services are visible before they are due.
- On time measured per service, within 10% of the interval, and done counted against what actually fell due.
- Parts and fluids on every service, issued from the warehouse when the PM is logged, with the cost posted to the machine.
- Inspections and findings with photos and readings, and breakdowns recorded against the machine, so the failure history the Weibull and P-F decisions need builds up on its own.
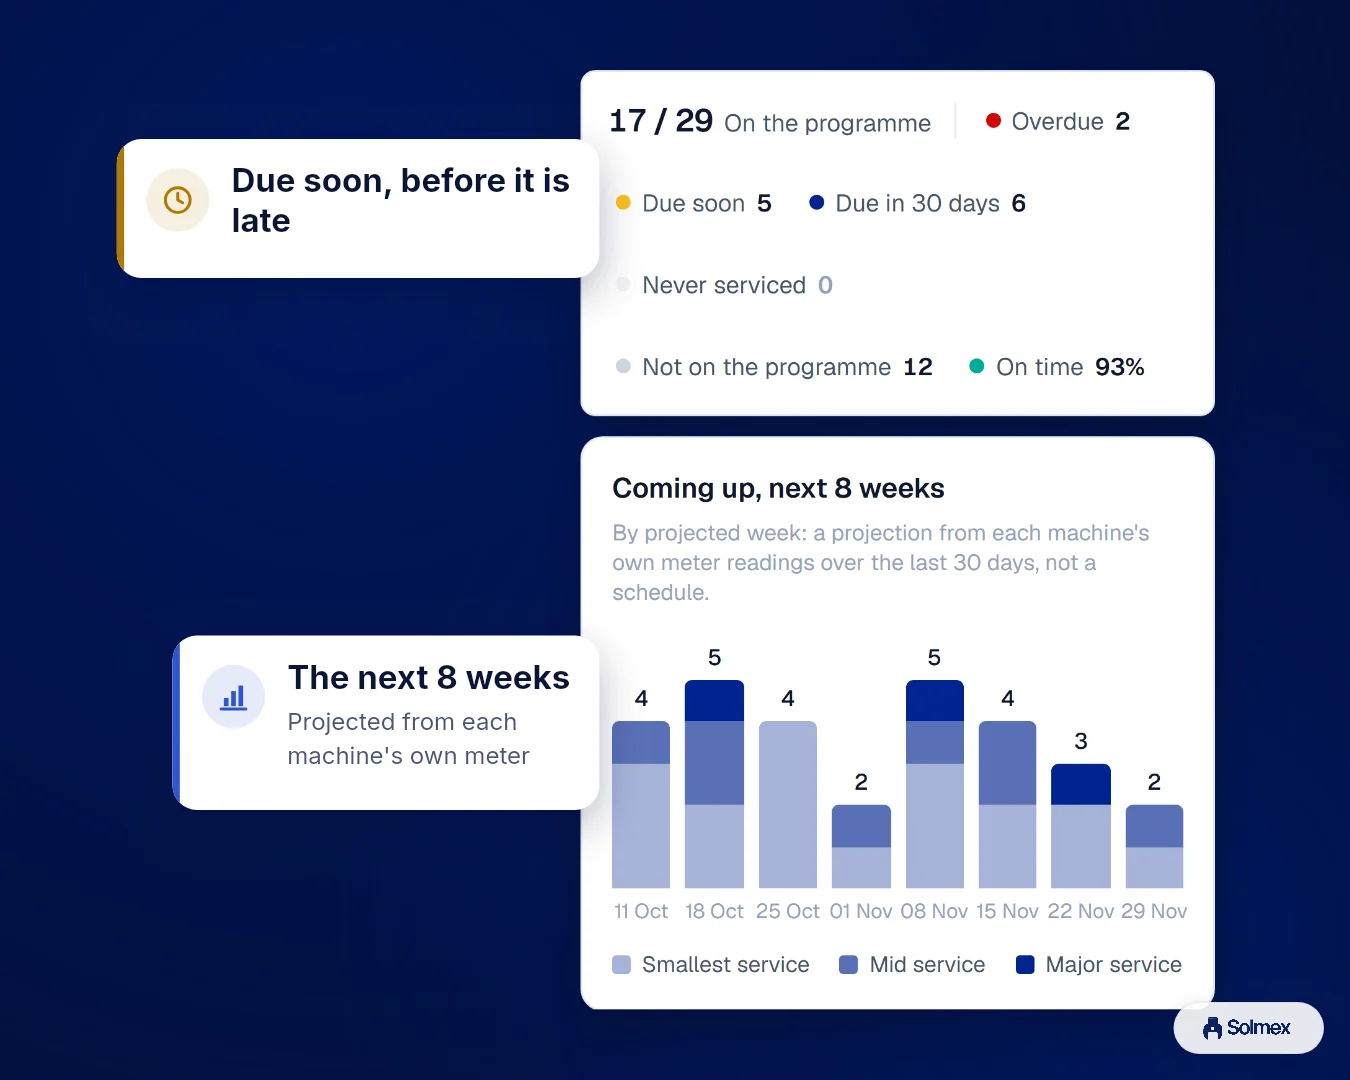
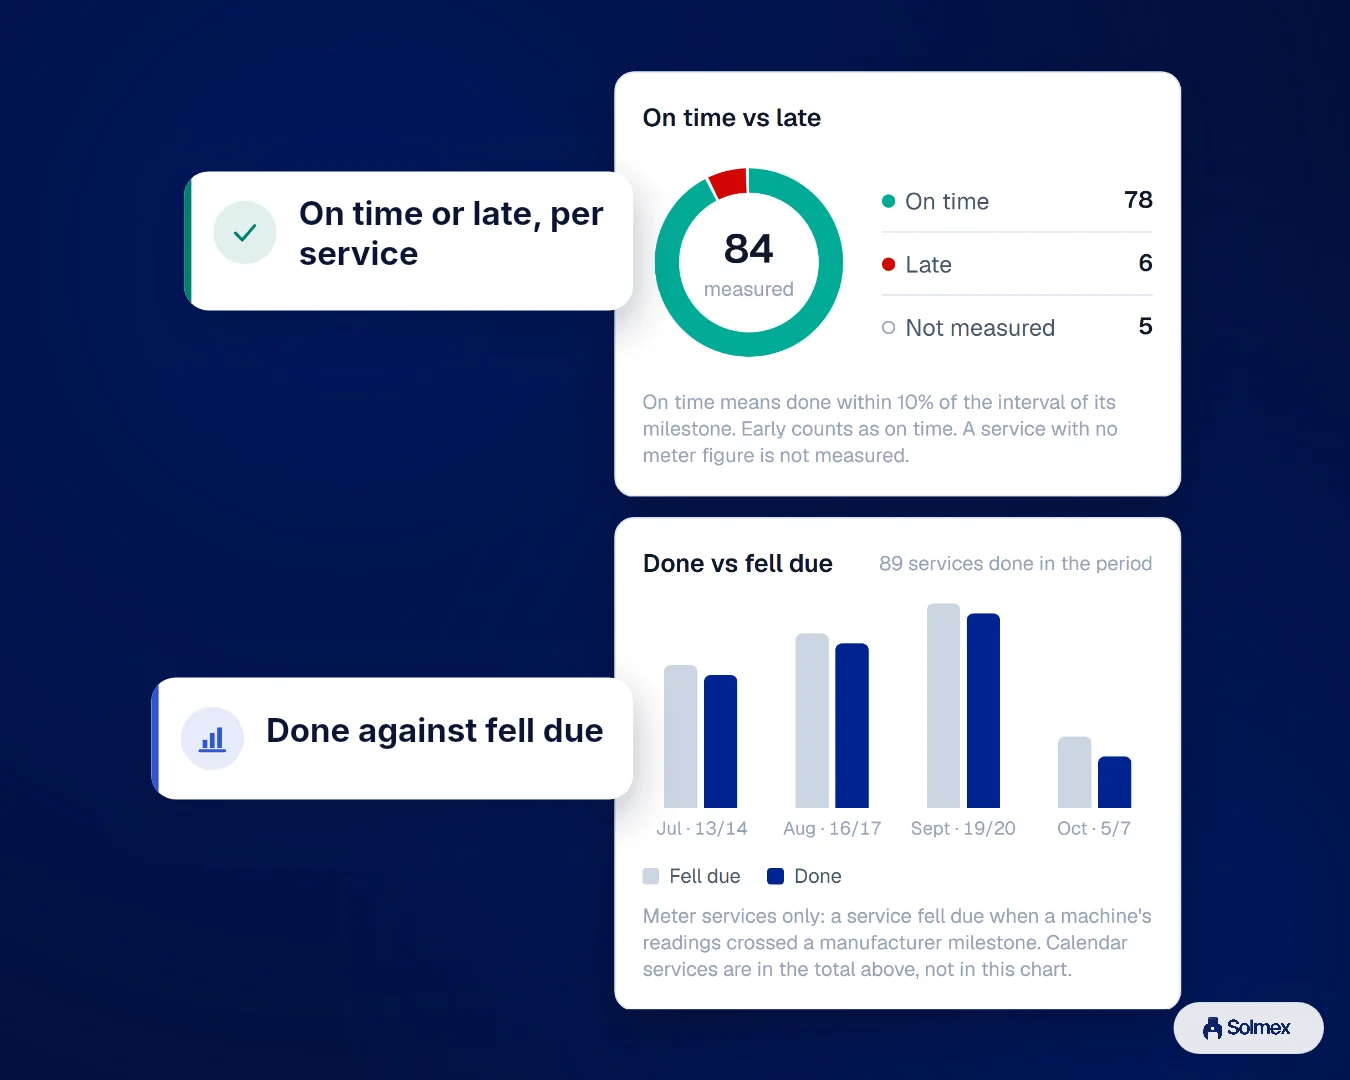
You can start free: the Business plan for 14 days with no card, then one user and up to 25 assets free for as long as you like. Or book a demo below and we will set it up with your own machines and your own service intervals.
Sources
Every figure above was checked in the source below on 15/10/2026. Where a figure is widely quoted from an original we could not open, the text names the source we did read.
- NASA, Reliability-Centered Maintenance Guide for Facilities and Collateral Equipment, September 2008. Figure 4-5 reproduces the failure-pattern data of Nowlan and Heap, Reliability-Centered Maintenance, US Department of Defense report AD-A066579, 1978.
- D. S. Thomas and B. A. Weiss, Economics of Manufacturing Machinery Maintenance, NIST AMS 100-34, June 2020.
- G. P. Sullivan et al., Operations & Maintenance Best Practices, Release 3.0, PNNL for US DOE FEMP, August 2010.
- Siemens, The True Cost of Downtime 2024, based on 181 interviews between April 2019 and March 2023; the Fortune Global 500 figure is an extrapolation.
- ReliaSoft (HBK), On-Condition Maintenance Using P-F Interval or Failure Detection Threshold, citing J. Moubray, Reliability-Centered Maintenance, Industrial Press, 1997.
- ReliaSoft BlockSim, Optimum Replacement Window.
- J. Shiver, 30 days' grace? Sorry, not so with a PM, Plant Services, 19/09/2017.
- Marshall Institute, 5-Day PM Optimization, case study.
- Goldman, Fiedler and King, General Aviation Maintenance-Related Accidents: A Review of Ten Years of NTSB Data, DOT/FAA/AM-02/23, 2002; figures as summarised in M. Busch, Savvy maintenance, AOPA, 2021.
- T. Allen, U.S. Navy Analysis of Submarine Maintenance Data and Development of Age and Reliability Profiles, Reliabilityweb.